Today brings a deep dive into federal spending, the national debt, and related fiscal aspects. We’re going to start by looking at the first data point: total federal spending. Again, we’re principally looking at this and other data points over the period of 1980 to 2023.
A NOTE REGARDING THE GRAPHS USED IN THESE ANALYSES: I produced all of these graphs using the website usgovernmentspending.com, and have compared the data from this site with the numbers from the Office of Management and Budget to ensure accuracy. I encourage you to visit usgovernmentspending.com and explore its wealth of information—including exact dollar amounts used to produce custom charts and graphs.
Federal Spending: Nominal Dollars
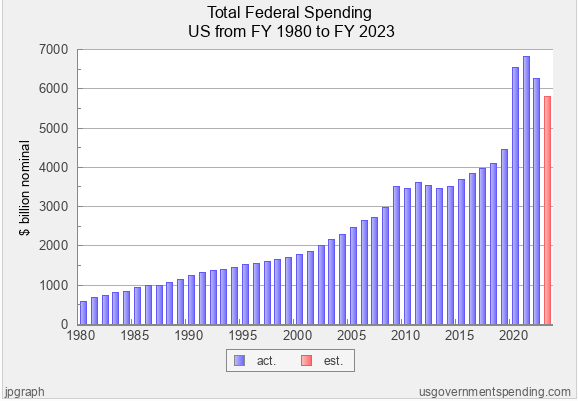
Below is Total Federal Spending in “nominal dollars” (the actual dollars spent at a given time) from the period of 1980 to 2023. Please note that the “year” is the federal fiscal year. Thus, for instance if you are looking at the bar for 1980, it’s the federal fiscal year that began on Oct. 1, 1979, and ended on Sept. 30, 1980.
Some insights and observations regarding the data above:
The average annual increase in federal spending from 1980-2023 is 5.45% per year.
During this period of time there was a huge increase in federal spending (from $591 billion in 1980 to $5,792 billion in 2023). This constitutes an average annual increase of 5.45% per year.
There are a few noticeable lurches in spending – what was going on during those times?
Spending appears to increase steadily until 2009, when it lurches up (from $2,982 billion in 2008 to $3,517 billion in 2009). Then, after several years of mostly stable or gradually increasing spending, there is another huge lurch in spending in 2020 (from $4,447 billion in 2019 to $6,553 billion in 2020), to $6,822 billion in 2021 (the all-time high), down somewhat to $6,272 billion in 2022, and down again to $5,792 billion in 2023.
In 2007 and 2008, there was a major collapse in the housing and financial markets, sending the country into its largest recession since the Great Depression. During the final year of George Bush’s Presidency (2008), a $168 billion stimulus package was passed (Economic Stabilization Act), along with the Troubled Asset Relief Program (TARP), which allowed the US Treasury to buy up to $700 billion of “troubled assets” and then recoup on these investments. Then, in the first year of Obama’s Presidency (2009) the $787 billion American Reinvestment and Recovery Act (AARA) was passed. The combined spending for these stimulus packages more than exceeds the spending increases that occurred in 2008 and 2009.
In March of 2020, it became clear that Covid-19 was becoming a worldwide pandemic. With all of the shutdowns and dislocations, the U.S. and other countries of the world were thrown into recession. Total civilian employment in the US fell by 21.0 million from the fourth quarter of 2019 to the second quarter of 2020; while the unemployment rate more than tripled, from 3.6 percent to 13.0 percent. To deal with the pandemic and the recession, a total of five stimulus packages were adopted, four of which occurred during the Trump Administration: The $8.3 billion Coronavirus Preparedness and Response Supplemental Appropriations Act (March 3, 2020), the $104 billion Families First Coronavirus Response Act (March 18, 2020), the $2.2 trillion “CARES Act” (March 27, 2020, the $900 billion Consolidated Appropriations Act, 2021 (December 27, 2020), and the $1.9 trillion American Rescue Plan Act of 2021 (March 11, 2021). The total spending on these Covid response and stimulus packages ($5,112 billion) does much to account for the $2,106 billion increase in spending in 2020, and the $2,375 increase (over 2019 levels) in spending in 2021.
If we go further back in time and extend the timeframe for analysis, we can verify that certain events or conditions almost always result in increased federal spending. Wars are the first such event. World War I and II, as well as the Korean conflict, the war in Vietnam, and the various wars in the middle east have all operated to increase federal spending—principally for defense. Second, recessions have typically been accompanied by increased federal spending—usually stimulus packages. We clearly see this in 2008-09, and 2020; but the recessions of 2001, 1992, and the early 1980’s also brought increased federal spending. Third are national emergencies or worldwide emergencies such as the September 11, 2001 terrorist attacks and the Covid-19 pandemic. Finally, we can affirm that federal spending tends to increase during times of high inflation (e.g. 1980-83, and 2021-22).
Inflation and population increases aren’t taken into account when looking only at “nominal dollars.”
Some of the significant increases in federal spending during early periods are difficult to see in the graph because the nominal spending metric doesn’t show the impact of inflation. For instance, if we converted the $591 billion in spending to 2012 dollars, the result would be $1,399 billion, which would definitely show up on the graph; and the visual impact would be even greater in 2023 dollars.
While the overall increase in spending during this 43-year period is staggering, the use of the metric of “nominal dollars” is misleading. During this very long period of time, the population of the country significantly increased. In addition, the cost of providing goods and services greatly increased due to inflation. An additional 108 million Americans (a 47.7% increase in population from 226.5 million to 334.5 million) are being served, and it is far more expensive to provide the same level of good and services with each passing year. If we were to adjust for these variables, we can assess the “real spending” increase.
Using the custom chart tools on usgovernmentspending.com we can get a sense of the increase in “real spending” by applying the “2012 per capita spending metric.” Essentially, this metric converts the nominal spending by year to dollar values in 2012, and then accounts for population change by computing per capita spending rather than total spending. Applying this metric, we see that “real spending” (2012 per capita) increased from about $6,175 per capita in 1980 to $13,888 in 2023. Again, we also see that per capita spending increased most in 2008-2009, and 2020-2021, when there were major recessions and the Covid-19 pandemic.
Spending spiked when both Democrats and Republicans had control of Congress.
Throughout the 43-year period, we can verify that spending has spiked under both Republican and Democrat Presidents and Congresses—at least during exceptional situations such as war, recession, national emergencies, pandemics, etc. In 37 of the 43 years, the Republicans have enjoyed either unified government (7 years of control of both the Presidency and both houses of Congress) or controlled the Presidency and/or at least one house of Congress (31 years). These conditions have enabled Republicans to exert influence on spending. In only 6 of the 43 years have Democrats enjoyed unified government.
In the graph, there are two clear periods when spending has either declined or largely been held in check—from 2010 through 2015, and from 2022 through 2023. Some of this decline is due to the fact that the stimulus packages are designed to be temporary in nature (not permanent increases), and some of decline can be attributed to actions by Republicans. After capturing the House of Representatives in the 2010 midterm elections, Republicans exerted considerable control on federal spending during Obama’s remaining years. On the other hand, the huge increase in spending in 2020 and the early part of 2021 occurred with Republicans in control of Presidency and the Senate.
Federal Spending as a Percentage of Gross Domestic Product (GDP)
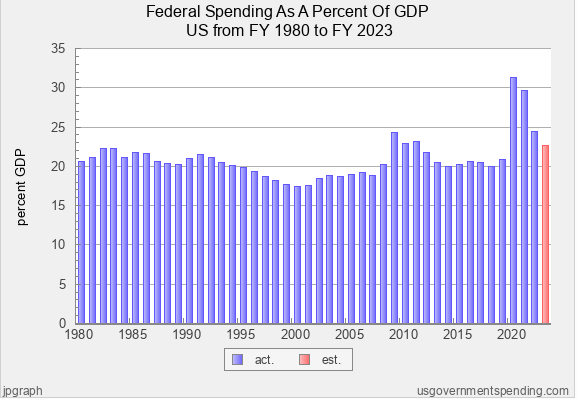
Examining a final metric will help us assess federal spending: “Total Spending as a percentage of GDP.” This graph displays total federal spending in a given year against the total value of goods produced and services provided in the US during that year. Thus, for instance, federal spending in 1980 (fiscal year), was about 20.7% of the country’s GDP for that year. Basically, we’re using the country’s total economic output as a way to assess the level of federal spending. In essence, spending by the government is some fraction of the nation’s output; and since the nation’s output increases along with the number of Americans and the costs of inflation, it gives us a way to include these factors in our analysis.
Federal spending in terms of percentage of GDP tends to increase during extraordinary times and decrease when the economy is strong.
A quick scan of the 43-year history reveals that for a significant number of years, federal spending has been in the range of 20 to 22% of GDP. During the period of 1995 through 2007, the percentage of GDP dipped to a range of 17-19%. Then the percentage jumped to 24.3% in 2009, and remained in the 22-23% range through 2011. Then, in 2020, the percentage jumped precipitously to 31.4% and 29.7% in 2021; and then started declining again to the range of 23-24% of GDP.
If we think about the numerator and the denominator of this equation the percentages make sense. As to the numerator, we have seen from the previous graph that we tend to spend more during recessions, wars, national emergencies, pandemics, etc. Thus, for instance, we saw major increases in federal spending during the recession of 2008-09 (stimulus packages), and the Covid-19 pandemic/recession of 2020 and 2021. On the other hand, during times of recession, it is common for GDP (the denominator) to decrease, as the total value of goods and services decreases during a struggling economy. Thus, when we have a larger numerator combined with a smaller denominator, the percentage goes up. On the other hand, when the economy is hot, such most of the period of 1995 through 2007, the GDP (denominator) tends to soar. Thus, the percentage can go down, even if federal government spending might be increasing in terms of nominal dollars.
In summary, if we examine the entire 43-year period, we see that federal spending in terms of percentage of GDP tends to INCREASE during extraordinary times (war, recession, national emergencies, pandemics, etc); and tends to DECREASE during times when the economy is very strong. The rest of the time, federal spending as a percentage of GDP consistently hovers in the range of 20 to 22%.
Next in the Series
EXPLORE THE WHOLE SERIES
Federal Spending and the National Debt

Brinkmanship on the Debt Limit: There’s a Better Way to Gain Control of Federal Spending and the National Debt (1 of 10)

An Objective Framework for Understanding the Problems Related to Federal Spending, Deficits, and the National Debt (Part 2 of 10)
Federal Spending (1980-2023): What Insights Can We Gain? (Part 3 of 10)

Federal Deficits and Total Federal Debt (1980-2023): What Insights Can We Gain? (Part 4 of 10)

US vs. Other Countries: How Do We Compare on Spending, Deficits, and Debt? (Part 5 of 10)
Revenues (1980-2023): What Insights Can We Gain? (Part 6 of 10)

Additional Insights on Federal Spending (Part 7 of 10)

Key Insights Gained From the Analysis of Federal Spending, Deficits, and Debt (Part 8 of 10)

Potential Solutions to Address Federal Spending, Deficits, and Debt: Applying Research and Insights as Opposed to Partisan Dogma (Part 9 of 10)

Leave a Reply