It has previously been noted that much of the discussion and debate regarding federal spending, deficits, and huge national debt has been and continues to be highly partisan in nature. The two parties, acting in concert with their respective media allies and interest groups, have been blaming and demonizing one another for years. This approach has tended to both hinder and distort an understanding of the problems and potential solutions. Meanwhile, the situation continues to fester; and Americans have become angry, divided, and increasingly cynical about whether the country will ever address spending, deficits, and the huge national debt.
The Current Partisan Approach Distorts Understanding: Why We Need a Road Map for Proceeding
This is the second installment in a deep dive intended to provide an objective framework for understanding problems related to federal spending, deficits, and the national debt. Through this more sophisticated and nuanced approach, my hope is to improve understanding of the problems and to provide some insights on how to proceed. In advance, I want to apologize for the detail that I am about to lay out. Simply speaking, I don’t think there’s any way of proceeding unless I provide a clear road map.
To begin, let me illustrate how the current highly partisan approach both hinders and distorts an understanding of the problem and potential solutions. Republicans have relentlessly attacked Biden and the Democrats for reckless and runaway federal spending, and for creating the highest national debt in the country’s history. They cite, correctly, that federal spending for fiscal year 2021 was the highest in history (almost $7 trillion); and that in just two years in office, the national debt under Biden has increased by more than $3.5 trillion (from about $27.75 trillion when he took office to about $31.4 trillion this January–which, indeed, is the highest national debt in history). Biden and the Democrats must be stopped, and Republicans must use every tool and strategy available to bring spending and the national debt under control.
Meanwhile, Democrats correctly point out that in Trump’s four years, the national debt increased by almost $7.8 trillion (from about $20 trillion to 27.8 trillion). They also correctly point out that under Trump, annual federal spending went from $4 trillion in fiscal year 2017 to $ 6.5 trillion in fiscal year 2020. They also point out that Trump and the Republicans irresponsibly passed a tax cut (Tax Cut and Jobs Act, 2017) that has substantially reduced federal revenues (verified by the nonpartisan Congressional Budget Office), making it even harder to balance the Budget and gain a measure of control over the national debt. Democrats also point out various legislative actions that have reduced the deficits in FY 2022 and FY 2023, and that will reduce federal spending in FY 2023. Democrats also argue that Republicans are out to cut Medicare, Social Security, health care, and other vital safety net programs.
In sum:
| What Republicans are Saying | What Democrats are Saying |
| Biden and the Democrats are engaging in runaway federal spending – currently have highest national debt in the country’s history | National debt increased by almost $7.8 trillion under Trump |
| Federal spending in 2021 was the highest in history (almost $7 trillion) | Federal spending went from $4 trillion to $6.5 trillion under Trump |
| National debt under Biden has increased by more than $3.5 trillion ($27.75 trillion to $31.4 trillion) | Republicans passed a tax cut in 2017 that greatly reduced federal revenue |
The blame game plays out with neither side willing to concede. Blaming the other side helps win elections and gain and maintain control of one or both houses of Congress. Blaming the other side incites and activates the party’s base. Members who try to moderate and find middle ground are punished (e.g., removed from committee assignments, primaried, given reduced campaign funding). Established processes for developing the federal Budget and spending are ignored. Instead, there is brinkmanship on statutory deadlines and last-minute deals on “Consolidated Appropriations Acts,” or kicking the can down the road via “continuing resolutions.” In the meantime, little is being done to actually address the problems.
Road Map for Analysis
Below is an outline for the approach that will be taken and systemically applied to the posts in this series.
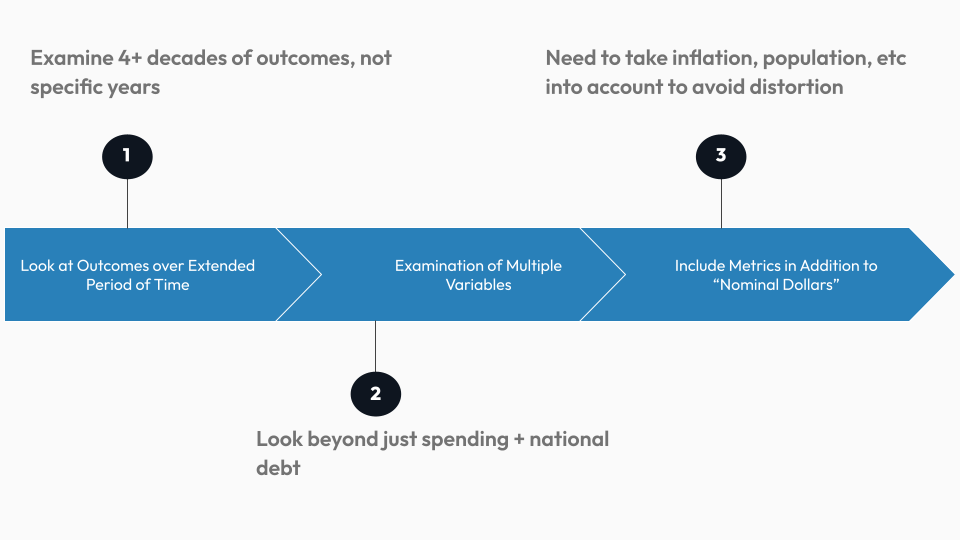
1. The analysis should address conditions and outcomes that occurred over an extended period of time.
The partisan approach allows the parties to cherry pick their evidence by selecting specific years or time frames that help make their case. To provide a more objective and revealing analysis, we need to examine conditions and outcomes that have occurred over long periods of time. Most of our analysis will include conditions and outcomes occurring over 4+ decades (from 1980 to the present day). Thus, for instance, we’ll examine federal spending over the period of 1980 to the present day, enabling us to see annual changes. This will also enable us to identify and consider historical events such as wars, recessions, pandemics, national emergencies, and who is in office and in control of the federal government.
2. The analysis should include significantly more aspects (data points) than federal spending and the national debt.
To fully understand the problems, we need to go beyond simply looking at Federal spending and the national debt. Our research will also include the following data points, which can be very influential:
- FEDERAL DEFICITS. We should consider the extent to which spending was in the black or the red each fiscal year. How often did we have deficits, and how big were they? And, what were the historical conditions?
- REVENUES. We should consider federal revenues that were generated each fiscal year. Are there historical conditions that drive revenues up or down?
- FEDERAL SPENDING BY PROGRAM. How has spending changed for the various programs within the federal Budget? Which program areas have grown, and which are being crowded out?
- INTEREST RATES/EXPENSES. We should consider how federal spending and the national debt were influenced by interest rates and payments. For instance, how often have high interest rates required us to devote a greater portion of our annual spending to interest payments and carrying the national debt?
- OTHER COUNTRIES. How does the U.S. compare with other countries when it comes to such variables as the national debt; and, to what extent is our national debt owed to foreign creditors?
- SPENDING FOR STATE AND LOCAL GOVERNMENT. How has spending for state government and local government changed over the same time period (1980 to present)? How does the rate of increase compare with the rate of increase in federal spending?
3. The analysis of data points should include metrics in additional to “nominal dollars.”
Because we are looking at a long period of time—42 years—simply looking at spending in terms of “nominal dollars” (i.e., the actual dollars spent at a given time) is distorting. During this period of time the total amount of inflation was 250%, which accounts for a significant part of spending increases. Also, during this period of time, the population of the country grew by 100 million people, a 43% increase. Thus, our analysis should apply metrics that enable us to take these aspects into account. The main additional metric we will be using is “percentage of Gross Domestic Product (GDP).” The GDP is total value of goods produced and services provided in a country during one year. Since GDP includes the variables of inflation and population change, we can use it as a basis for assessing our various data points (spending, deficits, national debt, etc.). For instance, if federal spending for a given fiscal year was $4 trillion, and the GDP for that year was $20 trillion, we can assess that spending as 20% of GDP.
In upcoming posts, I’ll try to present the above-described analysis in manageable chunks. I’ll then summarize what I view are “insights” we can take away from this analysis. And, finally, I’ll conclude with some thoughts about common interests and solutions that should be explored.
As always, your comments and critiques are invited. Here’s to a better method of problem solving and a good discussion.
Next in the Series
EXPLORE THE WHOLE SERIES
Federal Spending and the National Debt

Brinkmanship on the Debt Limit: There’s a Better Way to Gain Control of Federal Spending and the National Debt (1 of 10)

An Objective Framework for Understanding the Problems Related to Federal Spending, Deficits, and the National Debt (Part 2 of 10)

Federal Spending (1980-2023): What Insights Can We Gain? (Part 3 of 10)

Federal Deficits and Total Federal Debt (1980-2023): What Insights Can We Gain? (Part 4 of 10)

US vs. Other Countries: How Do We Compare on Spending, Deficits, and Debt? (Part 5 of 10)

Revenues (1980-2023): What Insights Can We Gain? (Part 6 of 10)

Additional Insights on Federal Spending (Part 7 of 10)

Key Insights Gained From the Analysis of Federal Spending, Deficits, and Debt (Part 8 of 10)

Potential Solutions to Address Federal Spending, Deficits, and Debt: Applying Research and Insights as Opposed to Partisan Dogma (Part 9 of 10)

Leave a Reply