We’re now going to focus on the critical data point of federal revenues. We’ll explore the extent to which revenues have varied over time, the factors that appear to affect revenue growth and decline, and the extent to which revenues have kept up with spending and the growth of the economy (GDP).
Federal Revenues: Nominal Dollars
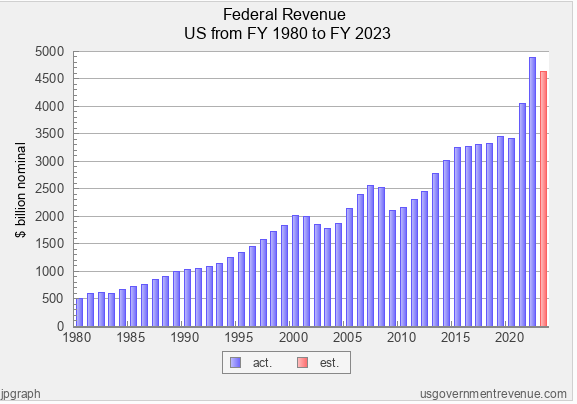
The graph below depicts total federal revenue in terms of nominal dollars (billions) over the period of FY 1980 to 2023.
Factors affecting government revenues include: the presence of extraordinary conditions, a strong economy, and tax cuts.
Federal revenues generally rose from 1980 to 2000, although revenue growth in the early 1980’s and the early 1990’s was relatively flat. Then we see a decline in the period of 2001 to 2003, before revenues started rising again. Then we see a steep decline in 2009 that lasted three additional years before recovering in 2013. Then we see steady increases until 2017, with several relatively flat years thereafter, and a slight decline in 2020. Finally, we see a large jump in revenue in 2021 and 2022, with a slight decline in 2023.
As we’ve learned from our prior analysis, the data points (spending, deficits, total debt, etc.) respond to extraordinary conditions (war, recession, national emergency, etc.). Let’s take a moment and identify key conditions that happened during this period:
- Recessions occurred in 1981, 1983, 1991, 2001, 2000-09, and 2020. The recession of 2008-09 was especially deep and took the economy several years to recover.
- In March of 2020, the US and the rest of the world was confronted with the Covid-19 pandemic.
- Major stimulus packages were adopted in 2008 and 2009. In 2020 and 2021, five separate stimulus packages were adopted, totaling over $4.2 trillion.
- Five separate tax cuts were enacted under Republican Presidents: the Economic Recovery Tax Act of 1981, the Tax Reform Act of 1986, the Economic Growth and Tax Relief Reconciliation Act of 2001, the Jobs and Growth Tax Relief Reconciliation Act of 2003, and the Tax Cut and Jobs Act of 2017). Two of the acts (1981 and 2001) were designed to stimulate the economy and help Americans during times of recession; and three of the acts (1986, 2003, and 2017) were enacted during relatively good economic times when Republican Presidents and Congresses decided to hold the line on spending. Finally, it should be noted that there is a lag time in terms of the revenue effects of tax cuts because they affect taxes in the year following the year of enactment. For instance, the Tax Cut and Jobs Act of 2017, affected taxes paid in 2018 and beyond.
- The US economy was strong during the mid-to-late 1980’s, most of the period between 1995 and 2007; and 2021, when the economy enjoyed its highest growth rate (5.7%) in nearly four decades. Strong economic growth continued into 2022.
Given these key conditions and events, the ups and downs of federal revenue during the 43-year period start to make sense.
- The relatively flat periods of revenue growth in the early 1980’s and early 1990’s are explained by the recessions of 1981, 1983, and 1991, and the tax cut adopted in 1981.
- The increase in revenues during the mid-to-late 1990’s is explained by the strong economy.
- The decline in revenues in the period of 2001 to 2003 is explained by the recession of 2001, and the tax cuts adopted in 2001 and 2003.
- The increase in revenues in the period of 2004 through 2007 is explained by the strong economy.
- The sharp decline in revenues in 2009 and the next three years is explained by the recession of 2008-09, and the weak economy thereafter.
- Strong revenue growth during the period of 2013-2015 is explained by the strong economy.
- Flat revenue growth in the period of 2016 to 2019 is explained by a weakening economy and the tax cut enacted in 2017.
- The decline in revenues in 2020 is explained by the recession of 2020 and the Covid-19 pandemic.
- The big jump in revenue in 2021 and 2022 is explained by the five major stimulus packages adopted in 2020 and 2021, along with a strong economy.
Federal Revenues: Revenues as a Percentage of GDP Haven’t Kept Up with Spending as a Percentage of GDP
Spending as a percentage of GDP outpaces revenues, and this is why there is always a deficit.
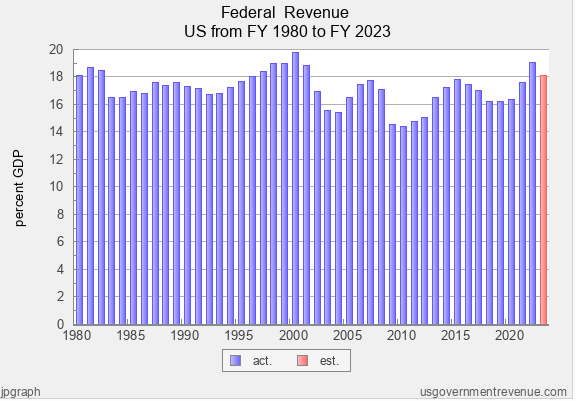
First, we can see that most of the time federal revenue has been in the range of 16-18% of GDP. Revenues were above 18% in 1980, 1981 and 1982; 1997 through 2001; and in 2021. Revenues were below 16% of GDP in 2003, 2004, and 2009 through 2012.
The fact that revenues as a percentage of GDP have been relatively stable is not surprising. As the GDP increases robustly, so should tax revenues. Also, as the GDP grows more slowly, tax revenues should also grow more slowly. Thus, in both instances, the numerator and denominator tend to be going in the same direction. The fact that tax revenues climbed above 18% of GDP in the late 1990’s to 2001, and again in 2021 is explained by very strong economies. The drop below 16% of GDP is mostly explained by tax cuts coming into effect and very weak economies.
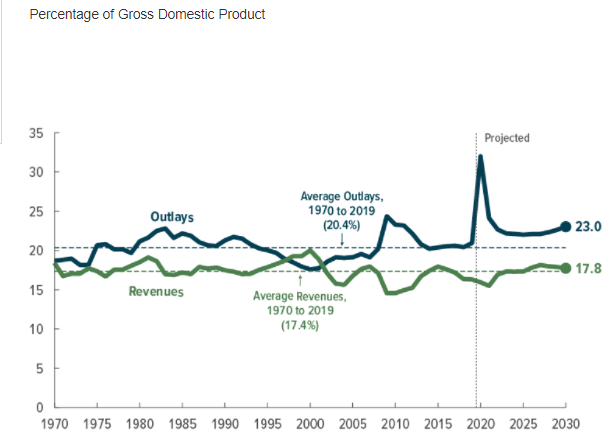
Going back to our prior analysis of spending, it’s clear that there’s a major problem between spending and revenues. Spending, as a percentage of GDP, has usually been in the range of 20-22%; yet revenues are usually in the range of 16-18%. It’s no wonder that deficits have been a regular feature for most of the 43-year period we’re exploring. The graph below illustrates the problem clearly. Since 1970, outlays (spending) have averaged 20.4% of GDP, while revenues have averaged 17.4% of GDP. That translates to an average annual deficit of 3% of GDP per year.
How Do Spending, Total Federal Debt, Revenue, GDP, and State and Local Spending Compare?
Let’s pull back to the 40,000 foot level and compare the 43-year growth rates for federal spending, the total federal debt, federal revenue, the gross domestic product, and state and local spending.
Here’s the big picture on some key data points:
- FEDERAL SPENDING increased by 880% (from $591 billion to $5,792 billion), which is an average increase of 5.45% per year
- TOTAL FEDERAL DEBT increased by 3,481% (from $.91 trillion to $32.59 trillion), which is an average increase of 8.68% per year
- FEDERAL REVENUE increased by 797% (from $517.11 billion to $4,638.19 billion, which is an average increase of 5.23% per year
- THE GROSS DOMESTIC PRODUCT increased by 795% (from $2,857 billion to $25,566.5 billion), which is an average of 5.23% per year
- STATE AND LOCAL SPENDING increased by 961% (from $432.33 billion to $4,587.73 billion), which is an average of 5.65% per year.
These statistics confirm that, cumulatively, federal spending has significantly exceeded federal revenue, and the total federal debt has increased at off-the-chart rates. On the other hand, spending for state and local government has exceeded the rate of increase for federal spending. And, finally, federal revenue has increased at the same rate as the gross domestic product.
The above provides an excellent springboard into the next post, where we will take a deeper dive into federal spending. We’ll examine how federal spending has changed in comparison with spending for state and local government; and we’ll examine how spending has evolved for the various programs of federal government (e.g., defense, Social Security, Medicare, Healthcare, interest).
Next in the Series
EXPLORE THE WHOLE SERIES
Federal Spending and the National Debt

Brinkmanship on the Debt Limit: There’s a Better Way to Gain Control of Federal Spending and the National Debt (1 of 10)

An Objective Framework for Understanding the Problems Related to Federal Spending, Deficits, and the National Debt (Part 2 of 10)

Federal Spending (1980-2023): What Insights Can We Gain? (Part 3 of 10)

Federal Deficits and Total Federal Debt (1980-2023): What Insights Can We Gain? (Part 4 of 10)

US vs. Other Countries: How Do We Compare on Spending, Deficits, and Debt? (Part 5 of 10)
Revenues (1980-2023): What Insights Can We Gain? (Part 6 of 10)

Additional Insights on Federal Spending (Part 7 of 10)

Key Insights Gained From the Analysis of Federal Spending, Deficits, and Debt (Part 8 of 10)

Potential Solutions to Address Federal Spending, Deficits, and Debt: Applying Research and Insights as Opposed to Partisan Dogma (Part 9 of 10)

Leave a Reply