Let’s examine how the United States compares with other countries in the world when it comes to spending, total national debt, and related fiscal matters. In so doing, we’ll also attempt to assess the actual risks and drawbacks associated with continued deficit spending and extreme levels of national debt.
When drawing comparisons with other countries, we need to account for at least two key variables.
- TOTAL GOVERNMENT SPENDING: The countries of the world vary considerably as to the configuration of their governments. While the US has three levels of government (federal, state, and local)—each with its own levels of spending—other countries of the world may only have one or two levels of government (national, national and state, or national and local). Thus, to do comparisons, we should use the data point of “total government spending,” which depicts total spending for all levels of government.
- PRECENTAGE OF GDP: Because the countries of the world vary so greatly in terms of the size of their economies and levels of spending for government, the metric of nominal dollars isn’t useful for comparisons. Instead, we’ll need to rely upon the metric of percentage of GDP.
US vs. Other Countries in Total Government Spending: Percentage of GDP
First, let’s talk national spending levels (annual spending) of the various countries. We saw from our prior analysis that, historically – and absent “extraordinary conditions” – the US annually spends 20-22% of its GDP for FEDERAL government. If there are “extraordinary conditions” (war, recession, pandemic, etc.) we found the US spends a significantly greater percentage of GDP. For instance, with the recession of 2008-09, federal spending was almost 25% of GDP; and with the pandemic/recession of 2020, spending was 31.4% of GDP in 2020, and 29.7% of GDP in 2021.
But what does US spending look like in terms of “total spending” for all three levels of government? Data from USgovernmentspending.com tell us that for all levels of government, the US typically spends 30-35% of GPD. In extraordinary times this goes up significantly. For instance, total government spending was 41.23% of GDP in 2009, 47.66% in 2020, and 43.09% in 2021.
US vs. Other Countries in Total Government Spending: 2019 vs. 2021
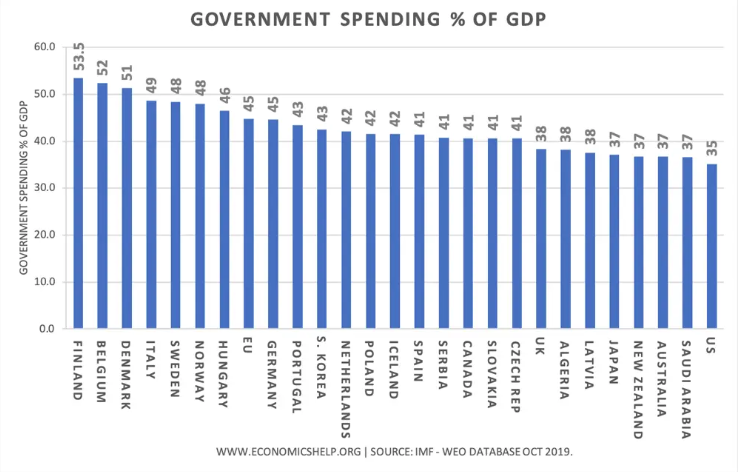
The graph below compares America’s total government spending with other countries in 2019. As you can see, total government spending for the US in 2019 was 35% of GDP, and this was at the low end of the spectrum for the countries listed. Other large economies not shown on the graph include China (34.1%) and Russia (32.6%).
But what about spending levels given extraordinary conditions, such as the pandemic/recession in 2020 and 2021? The chart below shows IMF data for 2021 (or latest available year), with some of the world’s largest economies highlighted. Again, the US is at the low end of the spectrum.
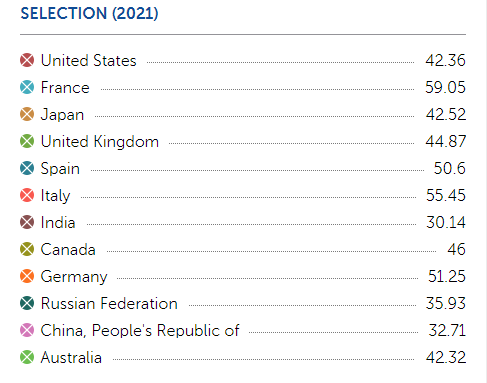
Thus, when we examine annual total government spending as a percentage of GDP, the United States does not appear to be an outlier. Our levels of annual spending by government are more moderate than most of the developed countries of the world.
US vs. Other Countries – Total National Debt: Percentage of GDP
Let’s shift to the data point of total national debt. The table below shows where 20 of the world’s large economies stand in terms of their national debt as a percentage of GDP. As you can see, the US is high up the list at 4th, with national debt at 132.8% of GDP in 2021. Several other large economies, including Canada, France, and United Kingdom, are close behind (over 100%). Not shown is Germany, at 77%.
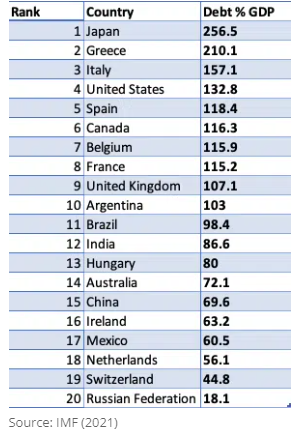
Overall, the United States does appear to have a higher level of total national debt than most large countries of the world. On the other hand, it’s clear that virtually all of the world’s large countries have very large levels of total government debt. The US is far from alone in this regard.
Negative Consequences of Huge Debt: Foreign Creditors and Interest Costs
The question thus becomes, what are the negative consequences of having a very large national debt? Most of the world seems to be operating in this mode. Are there some compelling reasons to be concerned? I’d like to address two: the costs of carrying this high level of debt (interest payments), and to whom the debt is owed (who are our creditors)?
The total national debt (currently at about $31.4 trillion) is comprised of numerous components. The graph below depicts the situation in September of 2022.
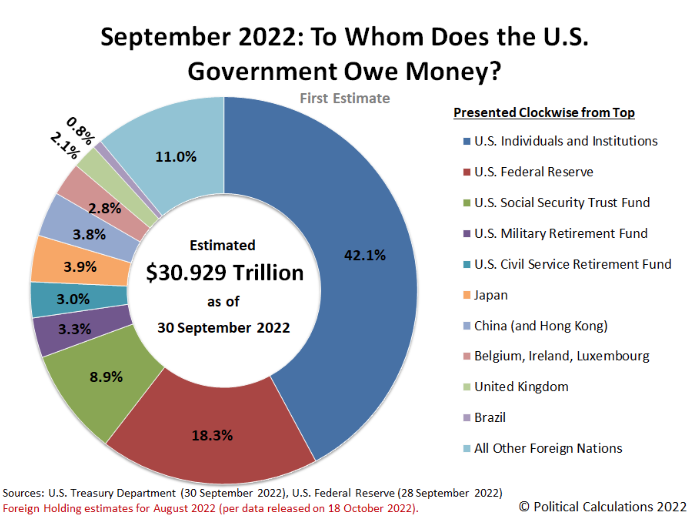
As you can see, about three-fourths of the debt is owed to US individuals and institutions (42.1%), the Federal Reserve (18.3%), the Social Security Trust Fund (8.9%), and the Military and Civil Service Retirement Funds. In terms of foreign creditors, the US owes money to Japan (3.9%), China (3.8%), the UK (2.1%) and a number of other nations. Clearly, America’s creditors are mostly American entities and individuals. The only country that is not an ally is China. Thus, in terms of potential risks or dangers from creditors, the US does not appear to be in any significant danger. However, the costs of carrying this level of debt are significant. The federal government is charged on its debts, just as a lender charges an individual interest for a mortgage or car loan. The amount of interest the government pays depends on the total national debt and interest rates of the various securities.
Interest Costs are Significant: Nominal Dollars and Percentage of GDP
The pair of graphs below show how much the US is paying each year in terms of interest expense: first in terms of billions of nominal dollars, and second in terms of the percent of federal spending for interest costs.
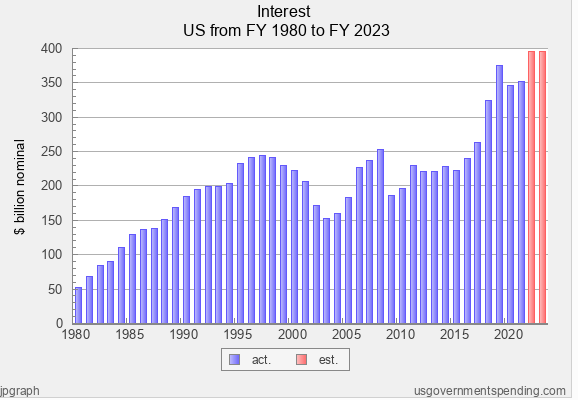
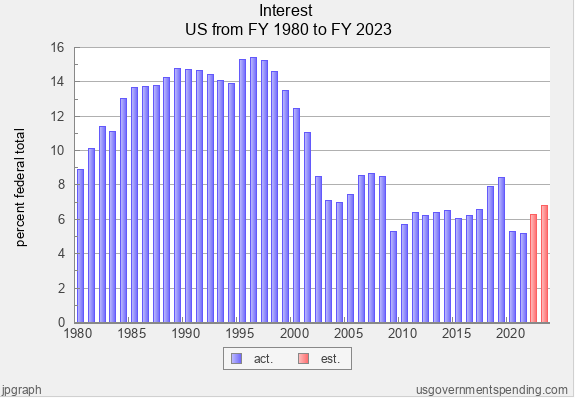
As the debt continues to climb, you would expect to see interest expense climb as well. Why is that not always the case?
As the national debt continues to climb, one would think that the amount of interest expense would also climb. But the total amount of interest paid in a given year depends in large part on the interest rates being paid on the various debts. With high inflation and increasing interest rates, the interest expense goes up. When interest rates are low, the amount of interest expense can remain low or stable.
Thus, in the mid-to-late 1990’s, interest rates were high, resulting in interest expenses of $200 to $250 billion per year. This resulted in 14% or more of each year’s total spending being required for interest expense. On the other hand, interest expense skyrocketed to between $350-400 billion per year in 2019 and beyond, mostly due to the skyrocketing debt during that period. Yet, because interest rates were low, the amount of interest expense only constituted 5-7% of federal spending for each of those years.
However, recent increases in interest rates and inflation are now resulting in an increase in interest expense. Regardless of whether interest expense is 6% or 14% of federal spending, $400 billion of interest expense each year is an amount to be concerned about.
Key Takeaways
- In terms of annual spending as a percentage of GDP, the US spends less than most developed countries of the world. On the other hand, the US carries one of the highest levels of total national debt (although most developed countries carry high levels of debt and aren’t that far behind the US).
- Given that most of our national debt is owed to American institutions, individuals, or American allies, there is minimal risk associated with actions of our creditors. However, the interest expense of carrying this high level of national debt is a factor to be concerned about.
Next in the Series
EXPLORE THE WHOLE SERIES
Federal Spending and the National Debt

Brinkmanship on the Debt Limit: There’s a Better Way to Gain Control of Federal Spending and the National Debt (1 of 10)

An Objective Framework for Understanding the Problems Related to Federal Spending, Deficits, and the National Debt (Part 2 of 10)

Federal Spending (1980-2023): What Insights Can We Gain? (Part 3 of 10)

Federal Deficits and Total Federal Debt (1980-2023): What Insights Can We Gain? (Part 4 of 10)

US vs. Other Countries: How Do We Compare on Spending, Deficits, and Debt? (Part 5 of 10)

Revenues (1980-2023): What Insights Can We Gain? (Part 6 of 10)

Additional Insights on Federal Spending (Part 7 of 10)

Key Insights Gained From the Analysis of Federal Spending, Deficits, and Debt (Part 8 of 10)

Potential Solutions to Address Federal Spending, Deficits, and Debt: Applying Research and Insights as Opposed to Partisan Dogma (Part 9 of 10)

Leave a Reply