
At a recent address to the Detroit Economic Club, the President proclaimed a “Trump Economic Boom.” He declared that “inflation is defeated” and “economic growth is at an all-time high.” In characterizing this remarkable transformation of the economy he boasted:
“By almost every metric, we have quickly gone from the worst numbers on record to the best and strongest numbers, the most dynamic numbers, and an economy that is far ahead of even my optimistic . . . schedule.”
President Trump, addressing the Detroit Economic Club on January 13, 2026
Knowing that Trump has a tendency to exaggerate and disregard the truth, I decided to do some research to validate his assertions. I took a deep dive into longitudinal data on the most commonly-used economic metrics. My quest was to find just how President Biden’s numbers compare with Trump’s numbers when it comes to key metrics like inflation, economic growth (Gross Domestic Product), job growth, the unemployment rate, and real wage growth (e.g., are wages keeping ahead of inflation?). And I wanted to document how prices compare, including food (groceries), gasoline, and electricity.
For ease of understanding, I put the results of my research into graphs, using official federal government data from the Federal Reserve of St. Louis (FRED). Let’s take a look and see just how much President Trump took our economy from worst to best.
1. Inflation is not defeated, and Trump’s inflation numbers for 2025 are no better than Biden’s numbers during his final year in office (2024).
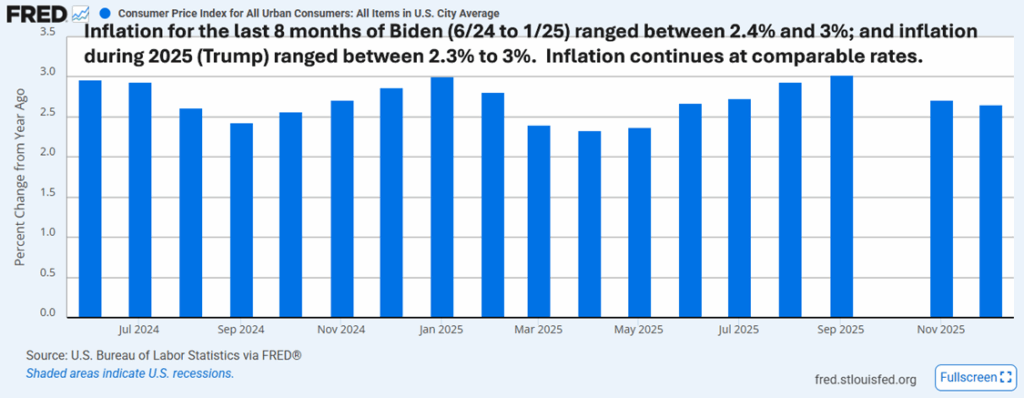
The graph depicts the inflation rate (monthly percent change from a year ago) going back to June 2024. For example, the 3% rate shown for September 2025 means that inflation went up 3% since September 2024 (a year ago). As you can see, inflation persists, currently averaging around 2.7%. If there were “no inflation” the rate would be 0.0%.
Trump is flat wrong in saying Biden’s numbers are the worst ever, and his are the best ever. Also, because the Federal Reserve has a goal of keeping inflation at or under 2%, the President cannot maintain that inflation is defeated. The truth of the matter is that under Biden, inflation rates stabilized in the 2.5 to 3% range. Since turning over the keys in January 2025, Trump has done no better.
2. Economic growth (Gross Domestic Product or GDP) is not at an all-time high in Trump’s first year; Biden’s GDP numbers are not the worst on record; and GDP growth under both Presidents was solid.
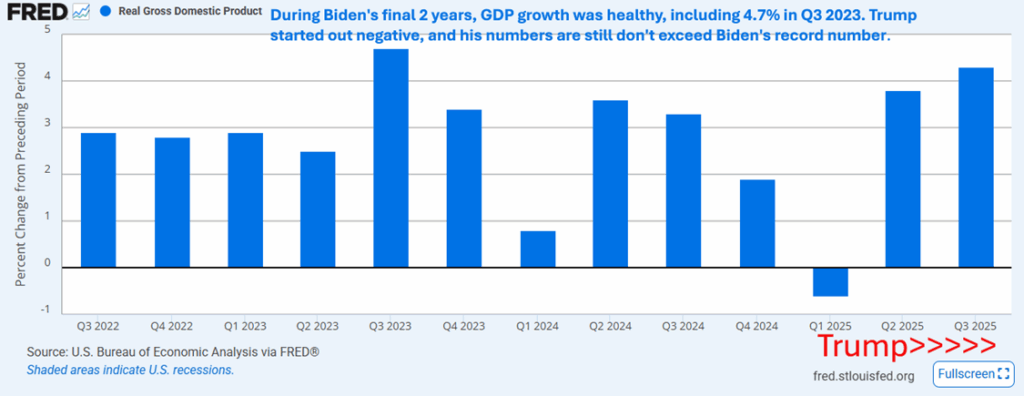
The graph shows that growth in the Gross Domestic Product (GDP) was very solid during Biden’s final two years, reaching a record 4.7% in the third quarter of 2023. Trump started out his presidency in the negative, but rebounded to a very solid 4.3% in the third quarter of 2025. If you go back decades in FRED data, you’ll see many occasions when GDP exceeded the 4.3% that Trump brags about. You’ll also see many occasions when GDP growth was far less than what occurred during Biden’s term. Trump is flat out wrong in characterizing Biden’s numbers as the worst ever. Also, he is flat out wrong in characterizing his current numbers as the best ever.
3. Trump’s numbers on job growth are far inferior to the jobs added during the Biden Administration, including Biden’s final year.
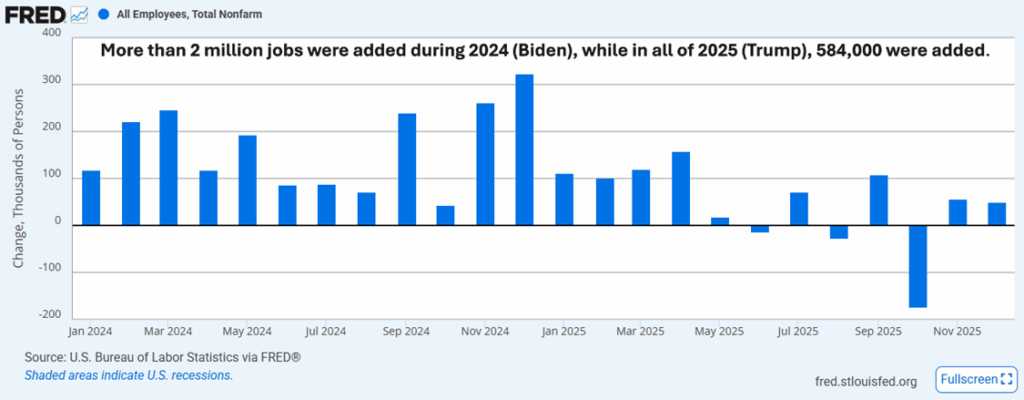
The graph shows that in the last year of the Biden Administration, more than 2 million jobs were added. During Trump’s first year, only 584,000 jobs were added. Three separate months in 2025 actually resulted in job losses. Thus, Trump is flat out wrong in saying Biden’s job numbers are the “worst ever” while Trump’s numbers are an all-time record. If you go back and look at decades of FRED data on job growth, you’ll see Trump’s 2025 job numbers are, in reality, mediocre.
4. The unemployment rates during Trump’s first year in office are mostly worse than the unemployment rates during Biden’s final two years in office (2023 and 2024).
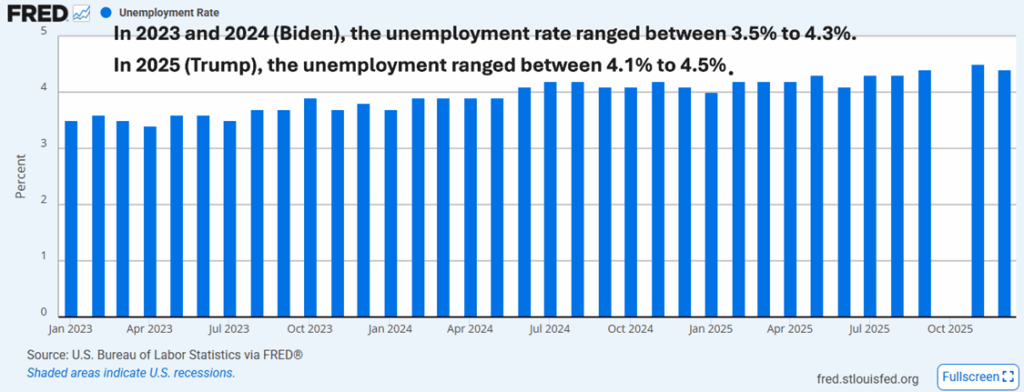
The graph shows monthly unemployment rates going back to January 2023. As you can see, unemployment rates in 2023 and 2024 (Biden) ranged from 3.5% to 4.3%). In contrast, unemployment rates during Trump’s first year ranged from 4.1% to 4.5%. Biden’s numbers are better than Trump’s. It is also flat out wrong to say that Biden’s numbers are a record worst, and that Trump’s numbers represent record low unemployment rates. If you go back decades in FRED data, you’ll see that Biden’s and Trump’s unemployment rate numbers are relatively good.
5. Real wage growth under Trump has been positive, but the same is true of Biden for his final two years in office; also, Biden’s results are not the worst, and Trump’s results are not the best.
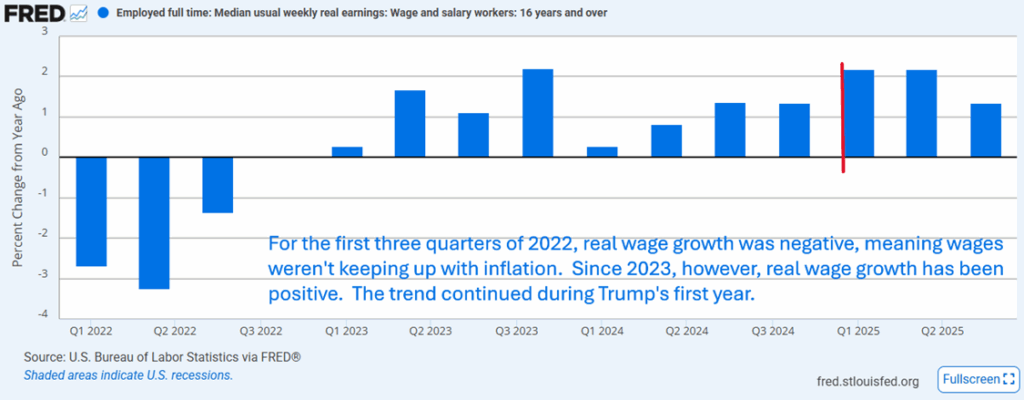
The graph shows quarterly results in terms of how wages are keeping up with inflation. For instance, the 2.1% shown for the first quarter of 2025 means that wages were 2.1% in excess of what was needed to keep up with inflation. On the other hand, you can see that real wage growth was negative during the first 3 quarters of 2022.
If you go back to 1980 and look at all the data on real wage growth you’ll see that Trump’s 2025 wage growth numbers are far from an all-time high. Also, Biden’s numbers are far from the worst ever. What you’ll see instead is that both Biden’s and Trump’s numbers are mostly average or slightly above average.
6. Prices for groceries (food at home) have gone up, rather than down, since Trump has been in office; and the rate of inflation for food is higher than during Biden’s last year in office.
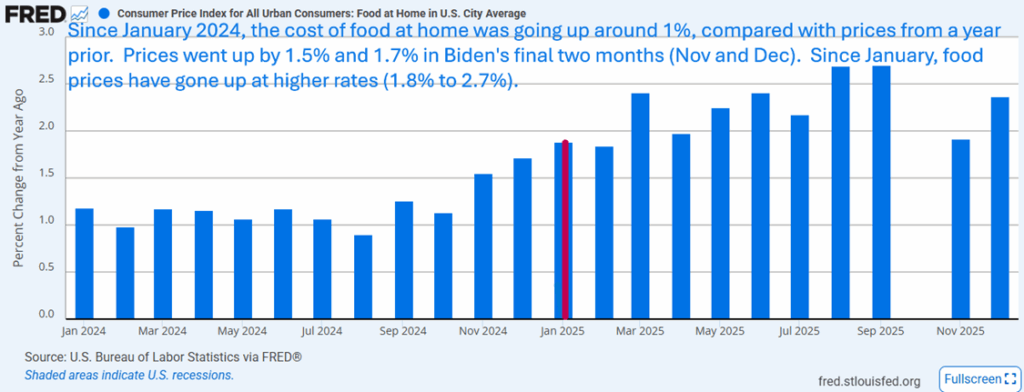
The graph shows the inflation rates for “food at home” going back to January of 2024. For example, the 1.5% rate shown for November 2024 means that “food at home” prices increased by 1.5% since November 2023 (one year earlier). The index for “food at home” consists of a market basket of grocery items that are most commonly purchased. Using this broader index alleviates the problem of cherry-picking certain grocery items to make a case that prices for groceries are up or down.
As you can see, food inflation during Biden’s final year was around 1% for most of the year. Since Trump entered office, food inflation has been over 1.5%, and at times exceeds 2.5%. Thus, Trump cannot argue that food prices have come down. Nor can he maintain that Biden’s numbers are an all-time worst, or that his numbers are an all-time best. In fact, if you go to 1950 and look at all the data on food inflation, you’ll see that Biden’s numbers are far from the “worst ever,” and Trump’s numbers are far from the “best ever.”
7. Prices for gasoline came down slightly in recent weeks (end of 2025/beginning of 2026); however, these prices are far from an all-time best and are at least partially driven by the drop in the global price of Brent Crude oil.
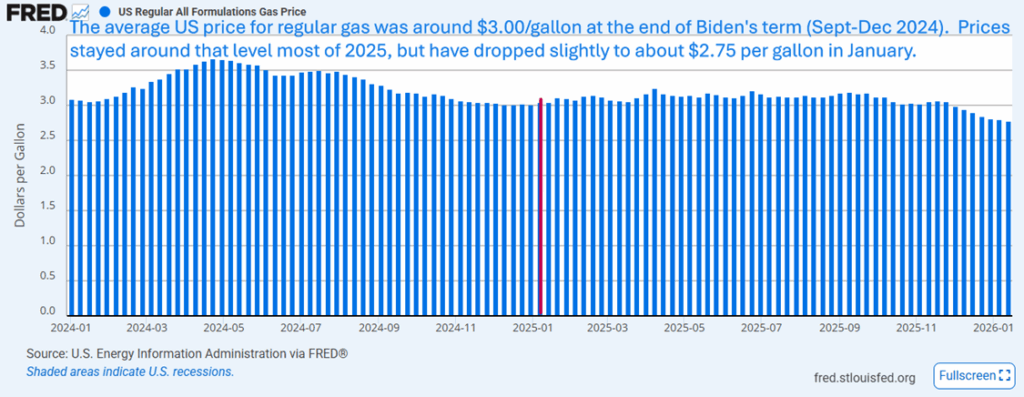
The graph shows the average cost for a gallon of regular gas on a weekly basis going back to January 2024. As you can see, for a period during 2024, gas was over $3.50 per gallon; but in the final months of Biden’s term, as he turned over the keys, the price was around $3.00 per gallon. Thus, the price of gasoline has gone down about 25 cents per gallon since Biden left office.
If you go back and look at all the data (1992), you’ll see that gasoline was at around $1.00 per gallon for many years, and that even at late as February 2016 (Obama) was at $1.72 per gallon. Current prices under Trump are not an all-time record; and the gas prices he inherited from Biden were far from an all-time high.
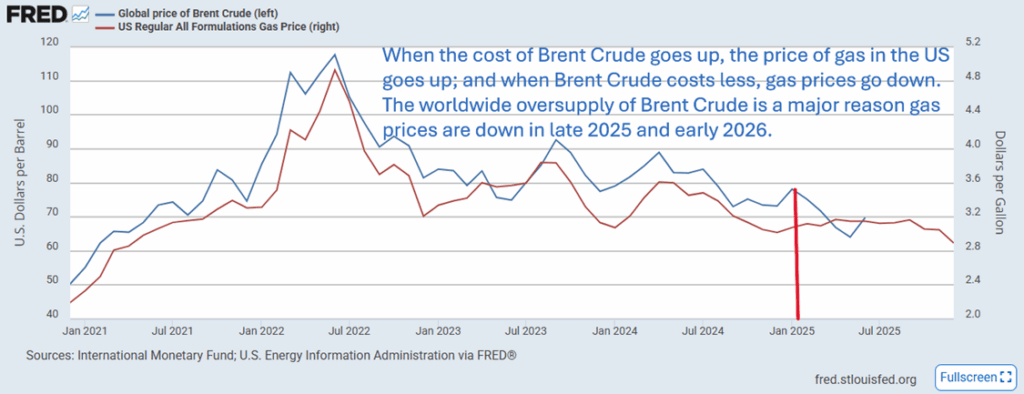
Finally, while Trump has made lowering gas prices a priority, and while he takes credit for doing so, does he deserve full credit? The graph below goes back to the start of the Biden Administration (January 2021) and displays the worldwide cost of a barrel of crude oil (Brent Crude) and the cost of a gallon of regular gas. As you can see, the lines closely track one another. When Brent Crude goes up, so does the cost of gas; and when Brent Crude goes down, so does the cost of gas. With Brent Crude currently hovering at around $63 per barrel, this represents a five-year low. There is a worldwide oversupply creating lower prices. Thus, Trump’s actions may not be the main or sole cause of the drop in gas prices.
8. Prices for electricity have gone up, instead of down, since Trump has been in office; also, prices under Biden were not at a record high (worst), and prices under Trump are not at a record low.
The graph displays the cost of electricity (average dollars per kilowatt hour, KWH) going back to January 2024. As you can see, during Biden’s last year in office, costs ranged from 17.3 to 17.8 cents per KWH. Prices jumped to 19 cents per KWH by June 2025, and remain near this level. Thus, the cost of electricity has not gone down under Trump. Nor can Trump claim that Biden was at fault for record high electricity costs.
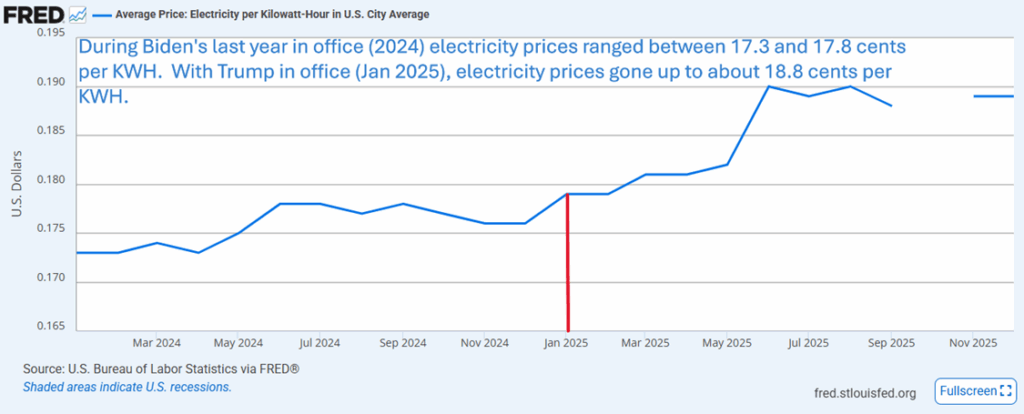
If you go back to 1978 and look at all the data, you’ll see the average cost per KWH tends to gradually go up over time. Prices did go up more rapidly in the last half of 2022, but by July of 2023, the annual rate of increase fell below 2.5%. When Trump entered office the annual rate of increase was at 3.5%, and currently prices are increasing at an annual rate of 7.4%.
9. During both the Biden and Trump presidencies, the stock market reached numerous all-time highs; the annual rates of gain were comparable under Biden and Trump; and wealthy Americans are the primary beneficiaries.
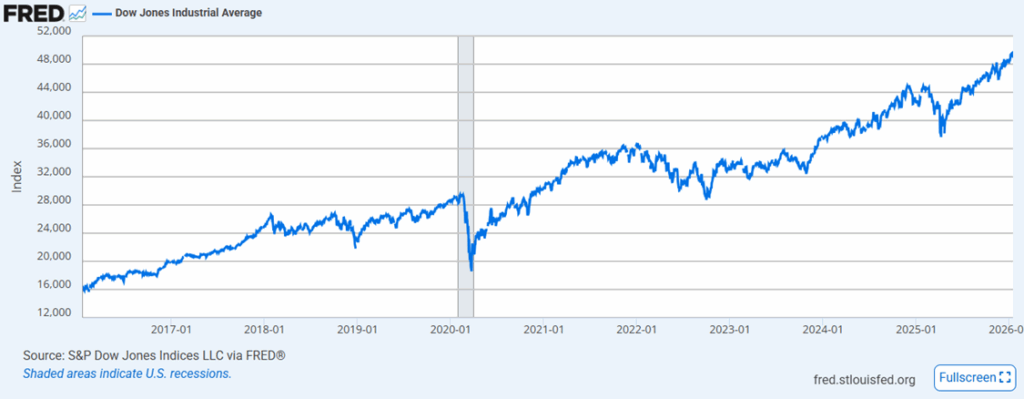
The graph shows the Dow Jones Industrial Average index going back to 2016. As you can see, the index tends to go up over time. During the time Biden was in office (2021-2024), the market reached numerous all-time highs. The same is true of the Trump Administration since January 2025. In fact, if you go back in time, virtually every President can claim numerous “all-time highs” regarding the stock market.
A better measure to assess stock market performance during a presidency is to look at the percentage gained (or lost) during each year of a presidency. Below I go back to Trump’s first presidency (2020) showing how the Dow Jones (blue) and S&P 500 (red) indexes performed compared to a year earlier. For instance, if you look at the most current 2026 numbers, you’ll see that both the Dow and the S&P 500 have gone up right around 20% over the period of January 2025 to January 2026.
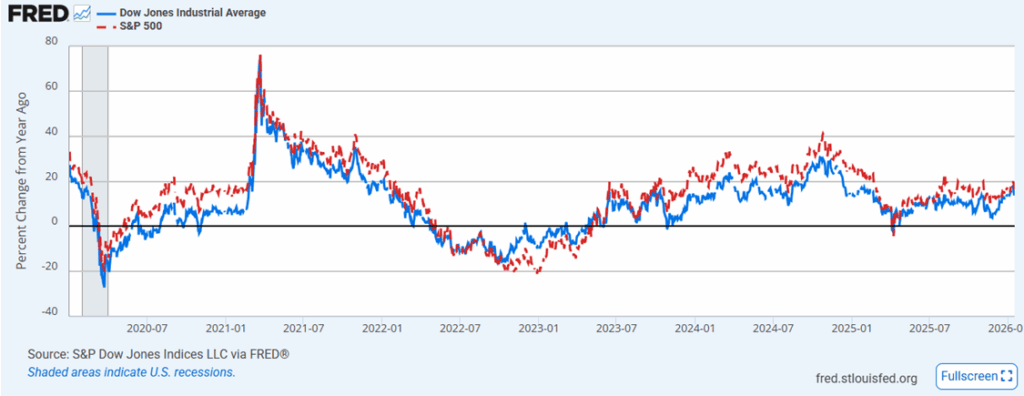
Looking at this graph, it’s clear that there were some bad performing years, such as when the markets lost over 20% in the spring of 2020 (Trump), and nearly that much in the summer of 2022 (Biden). There was also great performance early in 2021 (Biden) when the markets went up 70% compared to early 2020.
If we look at this metric for the years 2024 and 2025, we’ll see that the stock market performance under Biden and Trump are comparable. Biden did better than Trump, reaching a 30.6% gain in October 2024; while Trump’s maximum gain was reached on January 9th, at 18%. Overall, the markets performed relatively well during both presidencies. Trump, however, has no basis for saying Biden’s results are the “worst ever.” And while Trump can point to indexes reaching numerous record high levels, virtually every president before him could make this claim. And it’s likely that every president after him will be able to do so as well.
Finally, FRED data (2nd quarter 2025) show that the wealthiest 10% of Americans own 87.3% of all stocks (corporate securities and mutual funds). The bottom 50% in terms of wealth only own 1% of stocks. And those in the 50th to 90th percentiles of wealth only own 11.9% of stocks. The booming stock market that Trump crows about primarily benefits the wealthy.
Conclusion: For just about every metric, Trump has not taken the economy from “worst ever” to “best ever;” instead, Americans increasingly disapprove of his job performance and reject his false claims.
When we examine the actual data on the key economic metrics, most of Trump’s claims prove outright false. A year into his presidency, inflation is still too high. Most prices have gone up, not down. And job growth has slowed to a trickle, while the unemployment rate is creeping up. The growth in the economy is largely benefitting those in the top 10% of income or wealth. Most Americans continue to struggle to make ends meet.
Just about every major polling organization tracks increasing disapproval on Trump’s handling of the economy, inflation and prices. The disapproval percentages are now approaching nearly two-thirds of Americans.
Americans are increasingly concluding that Trump’s economy isn’t designed for them, but rather for the wealthy. An Economist/YouGov survey found 80% of us believe the rich have too much power ). The survey also found 80% of us think the gap between the rich and the poor is a “big” or “somewhat big” problem. It’s striking that 86.4% of all the consumer credit card debt in the US is owed by those who aren’t in the top 10% of the wealthy. Average credit card debt is now a record $7,321, and average household debt is now $138,000. These realities overpower Trump’s self-congratulatory, false boasts about a “Trump economic boom.”
In November of 2024, a majority of Americans believed what this spray-tanned candidate told us about ending inflation, lowering prices on day one, and creating the best economy ever. He can still put on a good snow job as he did at the Detroit Economic Club. But most Americans are no longer buying what he’s selling. The picture we now have of our President has devolved into what is shown below–a pathetic, lying, and increasingly-feeble conman.

Leave a Reply