Part 1 of a 2-Part Series

It’s common knowledge that President Trump’s job approval numbers have plummeted since he entered office just over seven months ago. In January, most polls reported his job approval at around 50%. As of late August, here are numbers from three highly-respected polls:
- Pew Research, August 14 has Trump at 38% approval and 60% disapproval
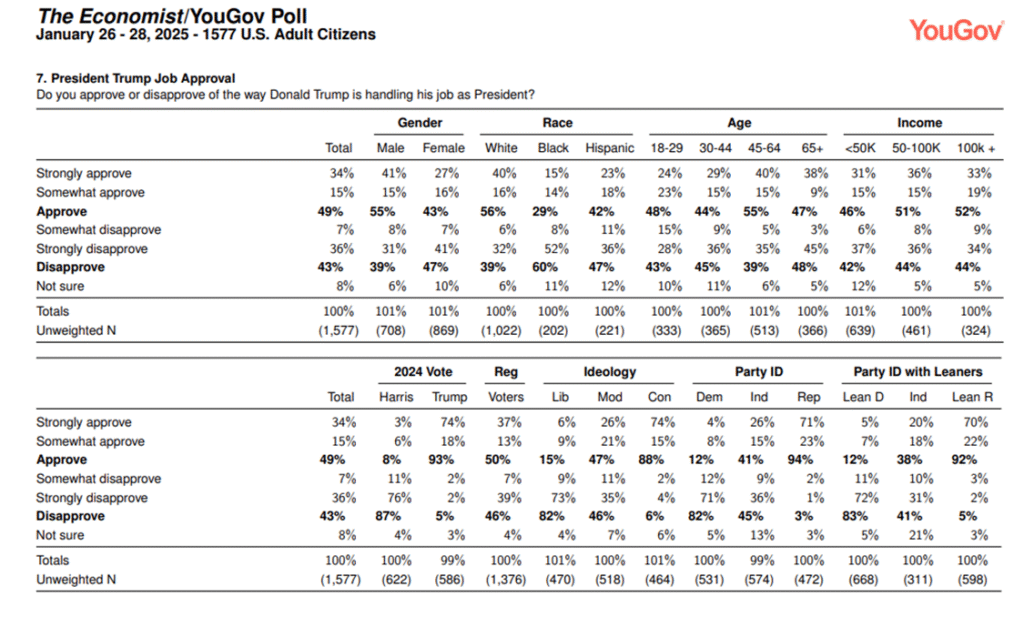
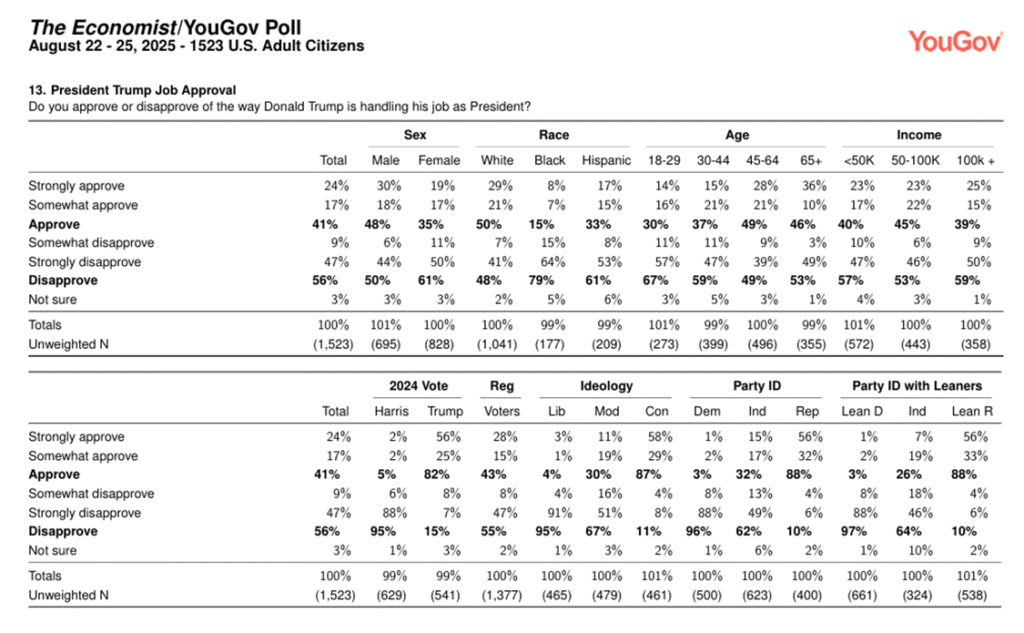
- The Economist/YouGov poll of August 22-25 has Trump at 41% approval and 56% disapproval
- The Gallup poll of July 7-21 has Trump at 37% approval and 59% disapproval.
The conventional wisdom explaining this sharp drop is that many Independents who voted for and initially approved of Trump’s performance are now disapproving. In addition, the same is being said with respect to younger voters, Hispanics, and Blacks who voted for Trump last November. On the other hand, most political pundits maintain that Republicans—Trump’s base—are steadfastly behind him, to the tune of 90 to 95% job approval.
While we know the declining approval percentages and the fact that certain demographic groups have soured on Trump’s performance, we know less about the reasons prompting these groups to be disapproving. For instance, while we can cite that 41% of Independents approved of Trump’s performance in January, and only 32% approved in August, we don’t know much about the reasons for this change in attitude. Only by taking a deeper dive into the demographic data can we tease out what is causing the erosion of support (approval) from Independents. Understanding the reasons enables us to assess whether the low approval numbers might be turned around, or whether they are likely to persist or worsen.
In addition, a deep dive into the demographics enables us validate the conventional wisdom I described above. In particular, just how solid and unflinching is Trump’s job approval from Republicans?
A two-part deep dive into the demographics of Trump’s falling job approval
In Part 1 of this series, we’ll examine demographic data from The Economist/YouGov polls on President Trump’s job approval. We’ll compare crosstabs on job approval—one just after Trump entered office, and a second at the end of August. This will enable us to see more precisely how approval ratings declined with respect to the demographic variables, including Political Party ID, Race, Age, Income, and Gender. I’ll lay out what I believe are the six key takeaways in terms of the demographics of the decline in job approval.
In Part 2 we’ll identify and assess the reasons for this drop in approval for each of the demographic groups identified. Additional Economist/YouGov data from surveys and trackers will help us understand what is driving each demographic group to sour on Trump’s performance. This will enable us to assess the likelihood of these job approval numbers and trends changing over the next one to three years. In particular, what is the likelihood that President Trump might be able to turn these declining numbers around? And what does this mean for the Congressional midterm elections in November of 2026?
Take a look at crosstabs on “President Trump Job Approval” from The Economist/YouGov Polls and make mental notes of what you see.
Let’s start the analysis by displaying the crosstabs on “President Trump Job Approval” from Economist/YouGov polls on January 26-28, 2025, and August 22-25, 2025. I invite you to compare the two tables below. See what conclusions you draw, especially as to the demographic groups where Trump’s job approval most eroded over this period of time. As a suggestion, I particularly encourage you to focus attention on the variables of Party ID, Gender, Race, Age, and Income.
Here are what I see as six key takeaways that tell us more precisely where Trump’s job approval has declined majorly or significantly.
After studying the tables displayed above, I came up with six key takeaways. To help explain these takeaways, I include data from NBC News 2024 Election Exit Polls telling us the percentage of each demographic group that voted for Trump in the November election. See if your conclusions match up with mine.
1. Major erosion in job approval from Independents
In November 2024, 44% of Independents voted for Trump. In January 26-28, 2025, 41% of Independents approved of Trump’s job performance, including 26% who “strongly approved”, while 45% disapproved. By August 22-25, 2025, only 32% of Independents approved of his performance, while 62% disapproved. Moreover, by August, only 15% “strongly approved” of Trump’s performance, while almost half (49%) “strongly disapproved” of his performance.
2. Significant erosion in job approval from Republicans
In November of 2024, 94% of Republicans voted for Trump. In January 2025, 94% of Republicans approved of Trump’s job performance (71% “strongly approve” and 23% “somewhat approve”). By August 22-25, 88% of Republicans approved of Trump’s performance (56% “strongly approve” and 32% “somewhat approve”). Thus, Trump suffered a 6 point drop in approval from Republicans (94% vs 88%), including a 15 point drop in Republicans who “strongly approved” of his performance (71% to 56%). Moreover, Republicans who “Disapprove” of Trump’s performance went from 3% in January to 10% in August.
3. Major erosion in job approval from Blacks and Hispanics; and a significant erosion in job approval from Whites
In November of 2024, 13% of Blacks and 46% of Hispanics voted for Trump. In January 2024, 29% of Blacks and 42% of Hispanics approved of Trump’s performance. But by August, approval by Blacks was at 15% (a 14-point drop), and approval by Hispanics was at 33% (a 9-point drop). Moreover, by August 64% of Blacks and 53% of Hispanics “strongly disappproved” of Trump’s performance.
The erosion in job approval from Whites was less pronounced, but still significant. In November of 2024, 57% of Whites voted for Trump. In January 2025, 56% of Whites approved of Trump’s performance; and by August, Whites approving fell to 50%. Disapproval, by August, was at 48%. Perhaps more significant, while 40% of Whites “strongly approved” of Trump’s performance in January, by August only 29% of Whites “strongly approved.” Still, Whites are the only other demographic group other than Republicans with approval percentages higher than disapproval percentages.
4. Major erosion in job approval from 18-29 age group, and significant erosion in job approval from all other age groups, except those 65 and over
In November of 2024, Trump won 43% of those 18-29, 47% of those 30-44, 54% of those 45-64, and 50% of those 65 and older. In January, Trump enjoyed net positive or near net positive job approval ratings from all age groups (18-29, 30-44, 45-64, and 65+). By August, his approval ratings from all these age groups except those over 65 dropped into negative territory. Only 30% of those 18-29, 37% of those 30-44, and 49% of those 45-64, approved of his performance. For those 65 and over, Trump’s job approval in January was 47%, and in August was 46%; and disapproval only inched up modestly. Trump’s job approval dropped most precipitiously with respect to those in the 18-29 age group. Approval from 18-29 year olds dropped from 48% to 30%. For 30-44 year olds the drop in approval was significant, moving from 44% to 37%, and for 45-64 year olds approval fell from 55% to 49%.
5. Significant to major erosion in job approval from all three income groups
In November of 2024, 50% of those earning less than $50,000, 52% of those earning $50,000 to $100,000, and 47% of those earning over $100,000 voted for Trump. In January, 46% of those earning less than $50,000, 51% of those earning between $50,000 to $100,000, and 52% of those earning more than $100,000 approved of Trump’s job performance. By August, approval ratings from all three of these income groups had dropped. Only 40% of those earning less than $50,000, 45% of those earning $50,000 to $100,000, and 39% of those earning over $100,000 approved of his performance. In seven months all income groups went from net approval of Trump’s performance to net disapproval. And for those earning more than $100,000 the erosion was major, going from 52% approve, 44% disapprove in January to 39% approve, 59% disapprove in August.
6. Major erosion in job approval from both Males and Females
In November 2024, 55% of males voted for Trump. In January 2025, 55% of males approved of Trump’s performance. By August of 2025, 48% of males approved of his performance. Disapproval from males was at 39% in January, but shot up to 50% in August. Moreover, males who strongly dissaproved went from 31% to 44% between January and August. While 43% of females approved of Trump’s performance in January, by August, job approval by females fell to 35%. And disapproval from females went from 47% in January to 61% in August.
These takeaways are validated by other research.
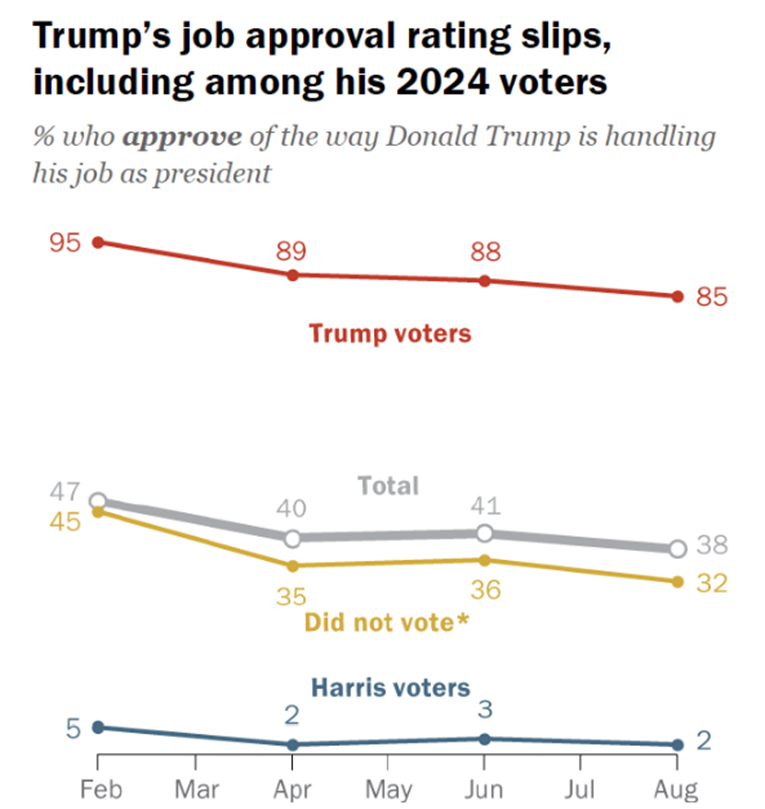
I did some additional research to confirm these takeaways. Two reports from Gallup (Gallup Presidential Approval-Trump, and Gallup, July 24) are both noteworthy and confirming. Also a Pew Research, August 14 report focuses on how Trump’s approval ratings are dropping across the board, including a ten-point drop among Republicans. It also documents that Trump’s approval ratings dropped 13 points with respect to those who didn’t vote in the November election. Here’s a revealing graphic from the Pew report:
Conclusion
In just over seven months, President Trump’s job approval percentages have declined either significantly or majorly for all but one of the 14 demographic groups identified (Independents, Republicans, Whites, Blacks, Hispanics, 18-29, 30-44, 45-64, 65+, those earning less than $50,000, those earning $50,000 to $100,000, those earning more than $100,000, males, and females). In fact, there are only two demographic groups—Whites and Republicans—where Trump’s approval percentage still exceeds the disapproval percentage. The erosion in job approval has been across-the-board, including, surprisingly, Republicans. As a consequence, it is clear the the coalition Trump put together to win the presidency has been seriously eroded.
Now that we have a better idea of how much President Trump’s job approval declined with respect to each of the identified demographic groups, we can turn to the question of what is causing these groups to sour on his performance. Can these numbers be turned around? And what do they portend for the midterm elections in November 2026? We’ll take on these questions in Part 2 of the series.
Leave a Reply